
ProcessModel 7 is not a point release. The application was rebuilt from the ground up, and the change runs all the way down: a new canvas to draw on, PM AI Bridge, which lets your own AI app work in your models, an Emergency Department palette, a report that names the one change worth making, an optimizer that searches for the best configuration on its own, and a simulation engine reworked for accuracy you can trust. Here is what is new, grouped by what it lets you do.
A ground-up ProcessModel
Open ProcessModel 7 and the first thing you notice is the canvas. A time-aware Welcome screen greets you, puts your demo models one click away and groups your recent models by day, and from there the canvas guides your hand.
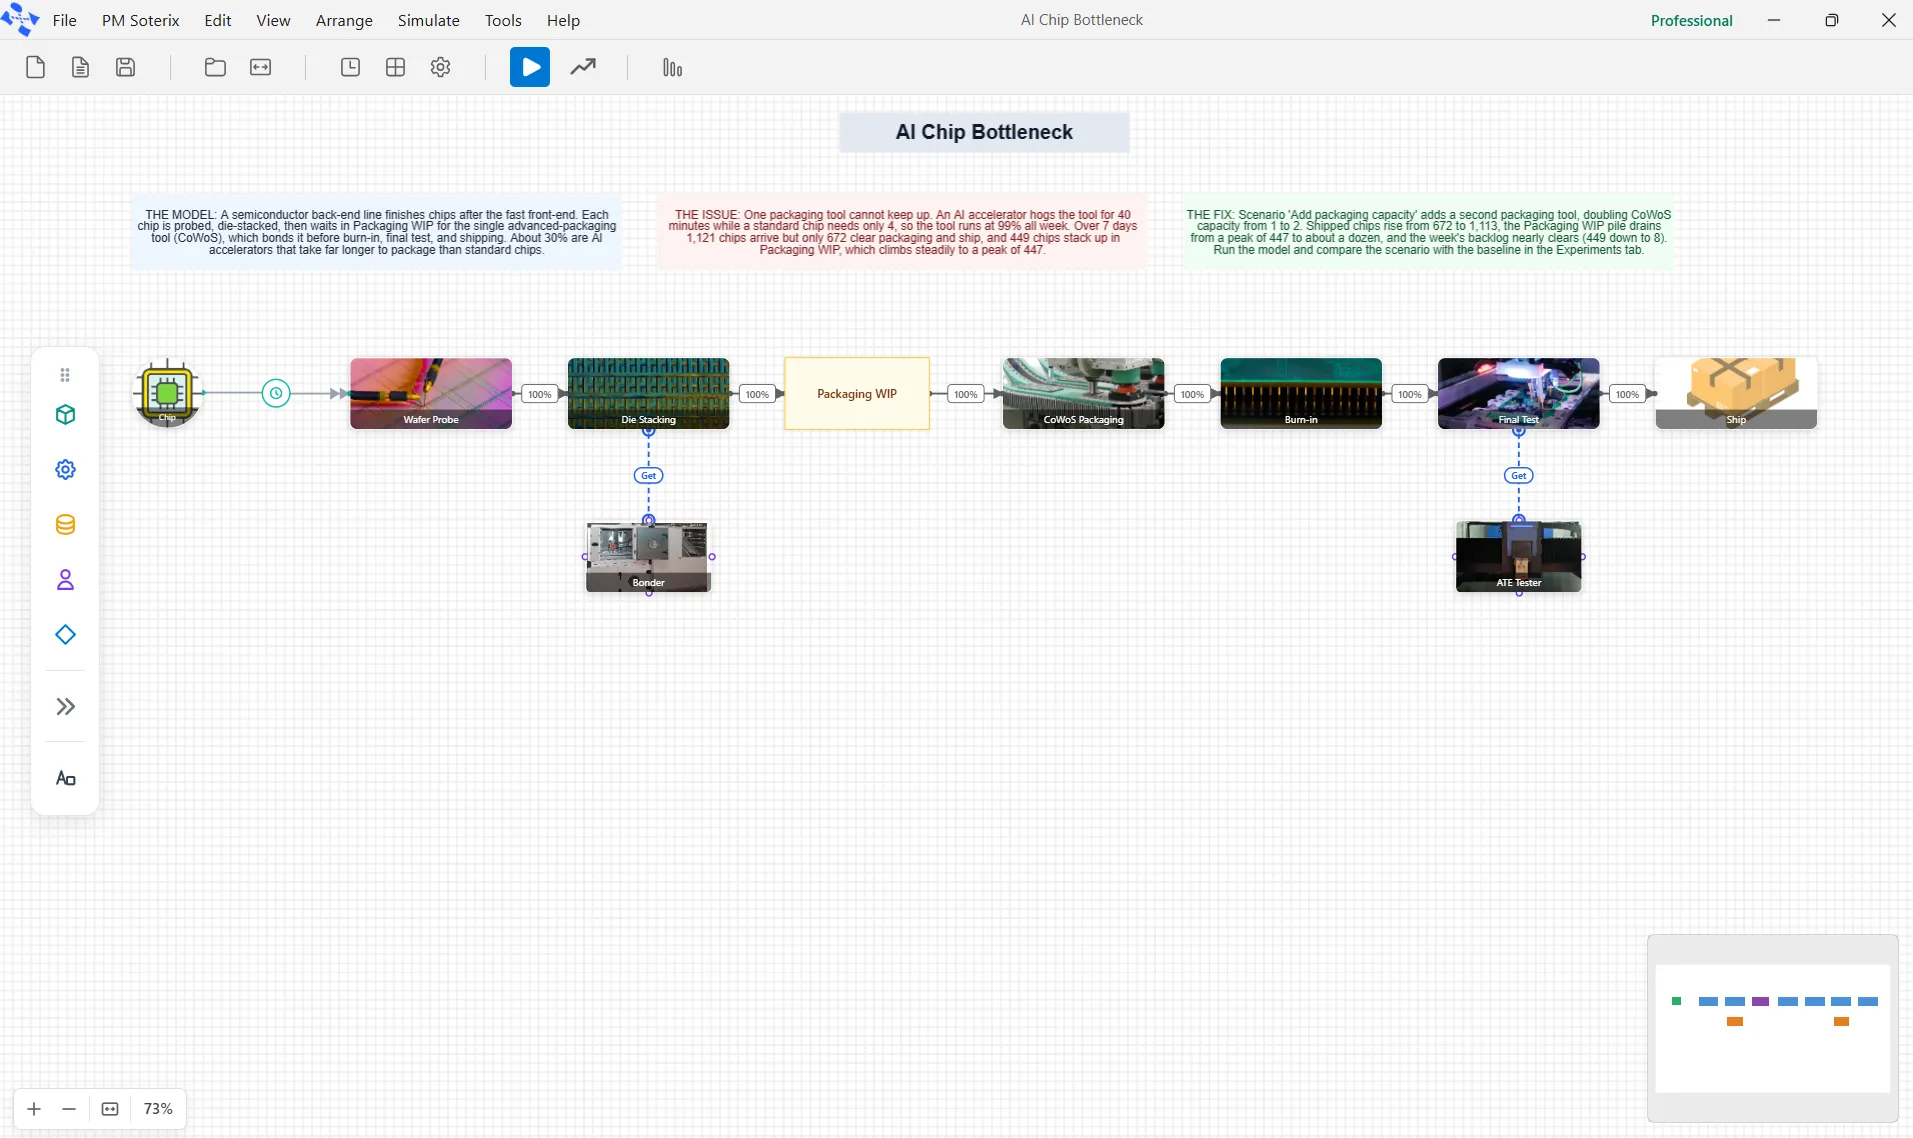
Helper lines line up your shapes as you drag them, a light grid keeps spacing even, and connections attach to the nearest border and steer around anything in the way. A color-coded minimap, alignment tools, and an Arrange menu that gathers the layout commands keep even a large diagram tidy, Fit to View brings the whole model back into the window in one click, every model opens framed in the window so you are never left hunting for your shapes, and the look of your routes saves with each model. Settings, on the Welcome screen, holds the choices that belong to your computer rather than to one model: the minimap, the grid, a light or dark display, and the currency symbol.
PM AI Bridge: your own AI app, working in your model
PM AI Bridge lets your own AI app, installed on the same computer as ProcessModel, work with your model for you. Ask in the AI app’s own window and it can read your model and check it for problems, change anything in it that you can change, run it, read the results from the Output Report, and open PM Optimizer to run or screen a study. The AI is yours: you use the app you already have, with your own account, and ProcessModel does not provide, operate or sell one.
PM AI Bridge is part of Professional, and it is off on the Personal license. Turn it on in Settings, under AI Integration. Before it turns on, a window says what that means in three plain points: what your AI reads is sent to its provider, how your data is used depends on your plan, and your AI subscription is your own. Choose “I understand” and a Set up window walks through four steps: have an AI app on this computer (Claude Desktop, Cursor, Google Antigravity, Grok Build and OpenAI Codex all work), paste one line into your AI’s own window, restart your AI, and paste a second line to check that it can reach ProcessModel. An AI you only use in a web browser cannot reach ProcessModel.
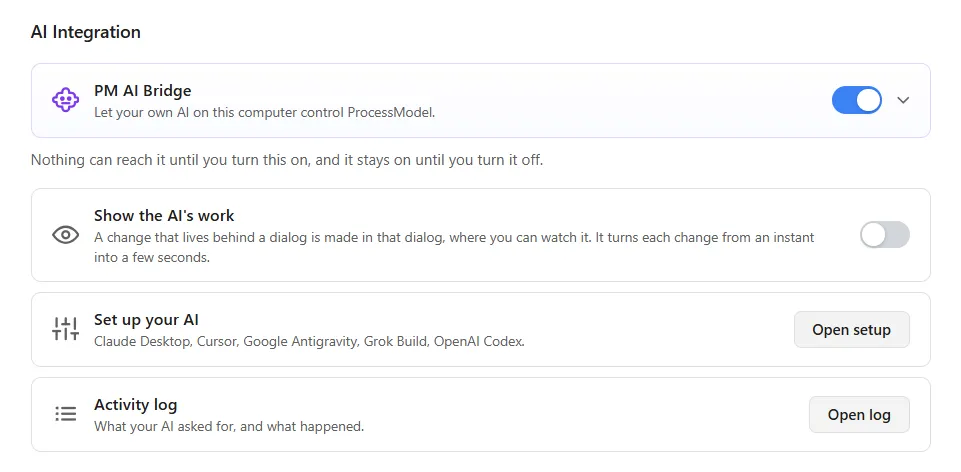
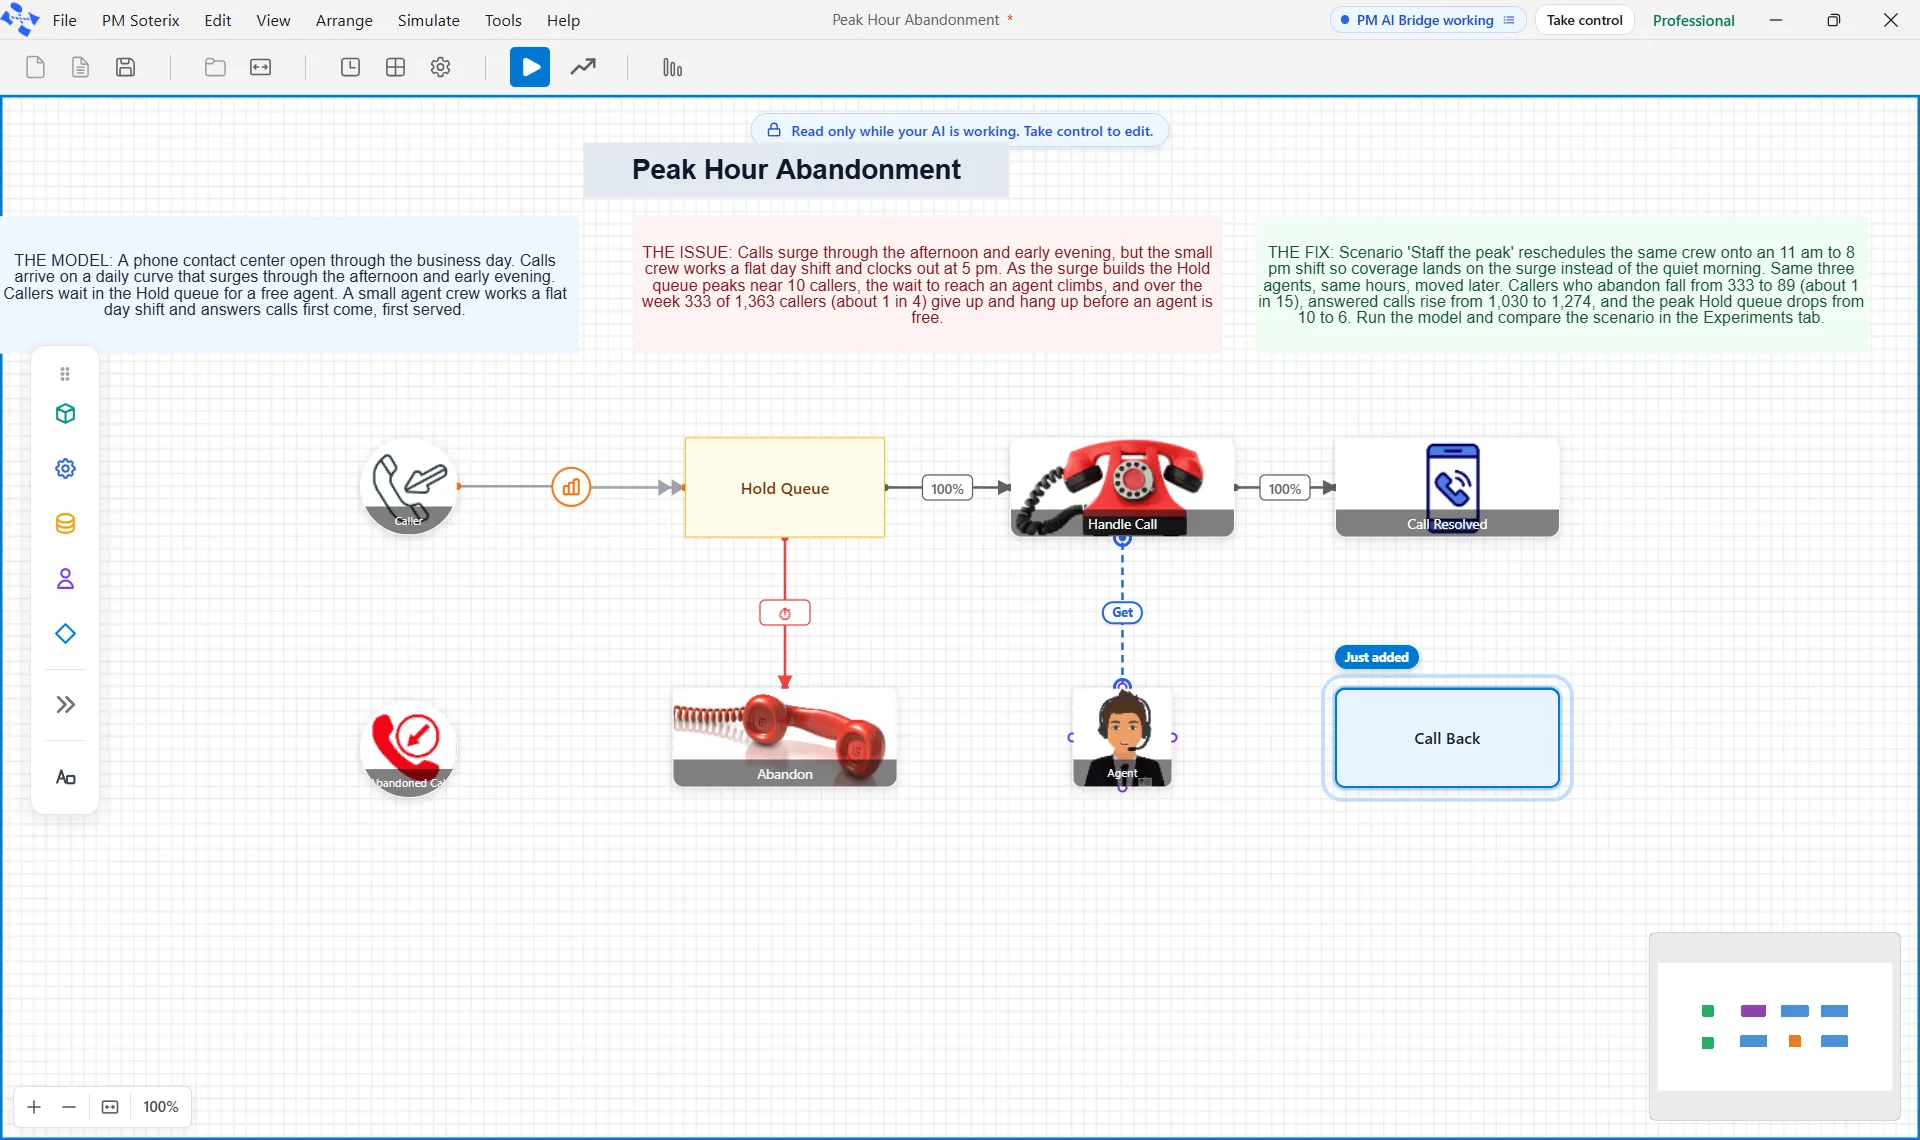
You stay in charge while your AI works. The title bar reads PM AI Bridge working, with a Take control button beside it, and the canvas is read only: a blue edge runs around it and a label says “Read only while your AI is working. Take control to edit.” The shape your AI just added or changed wears a ring and a tag such as Just added. Take control asks first, then hands the model back at once: a run your AI started stops, its next request is refused, and what it already did stays as one step in Undo.
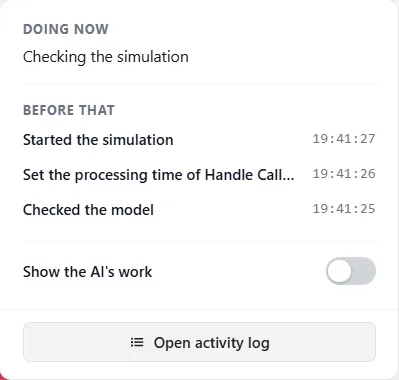
Everything your AI asks for goes into an activity log, with what was asked and what ProcessModel did about it, and you can export it as a text file. ProcessModel refuses your AI wherever it would refuse you, and wherever a request would lose work you have not saved, with its own sentence saying why. Turn on Show the AI’s work and a change that lives in a dialog, such as the Logic Builder, is made inside that dialog for a couple of seconds while you watch.
Your model, your settings and your results go to whoever provides your AI, because your AI is what reads them, so check the data settings of your plan before you work with confidential models. The full walkthrough is in the PM AI Bridge help, and your own AI app, working in your model tells the story in a shorter read.
Emergency department modeling
ProcessModel models an emergency department the way it models any process: patients arrive, wait for a space, are seen and leave. Open View ▸ Show Industry Palette, choose Healthcare, and the Emergency Department face opens with a palette, a lens and a report.
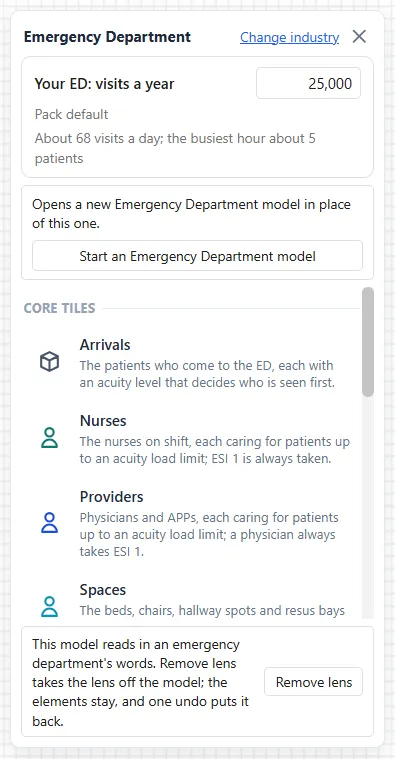
The palette is twelve tiles, from Arrivals to Discharge / Admit, and each one arrives sized to a single number: the visits your department sees in a year, typed in a box at the top. Nurses, providers, beds, chairs, registrars, resus bays and the arrival pattern all follow it, each tile is wired to the tiles already on the canvas in whatever order you drop them, and a drop is one Undo. Change the visits later and a window offers to resize what you placed, with anything you edited by hand keeping your value.
Or start from a typical department. One button, Start an Emergency Department model, opens a window where you enter your visits a year and see the inputs it will use for that size, the mix of acuity levels, admissions and how much one day differs from the next, beside the national figure. Build the model and a working model of your size opens, set to run 30 days, 10 runs, with 2 days to settle in. It is a new, unsaved model, and if the model you have open holds unsaved work you are asked about it first.
A care model adds a way of running the department. Provider in Triage puts a provider at triage to treat and release the simple cases and send the rest on. From 12,000 visits the start screen asks whether your department has one, and a scenario can switch it on or take it out, so you see what it does to waiting and cost before you change anything.
A lens changes what you read, never what is computed. With the Emergency Department lens on, an entity reads as a Patient, a queue as a waiting area, and the run settings say Settle-in time and Runs. A Locale setting changes the triage scale and the words to match for the United States, Canada, Australia and the United Kingdom.
The report is the department’s own: seven headline tiles above six tabs, Front Door, Flow, Getting Out, Crowding, Team and Spaces, and Money. The tiles read door to provider, time in the ED, boarding, walked out, crowding, CMS ECAT and cost per patient, and a Rules strip under them names the lines the report is scored against. Front Door times the wait to triage, to a space and to a provider and says why patients waited, Getting Out shows how visits ended and what admitted patients waited for, and Crowding charts how full the department was, hour by hour.
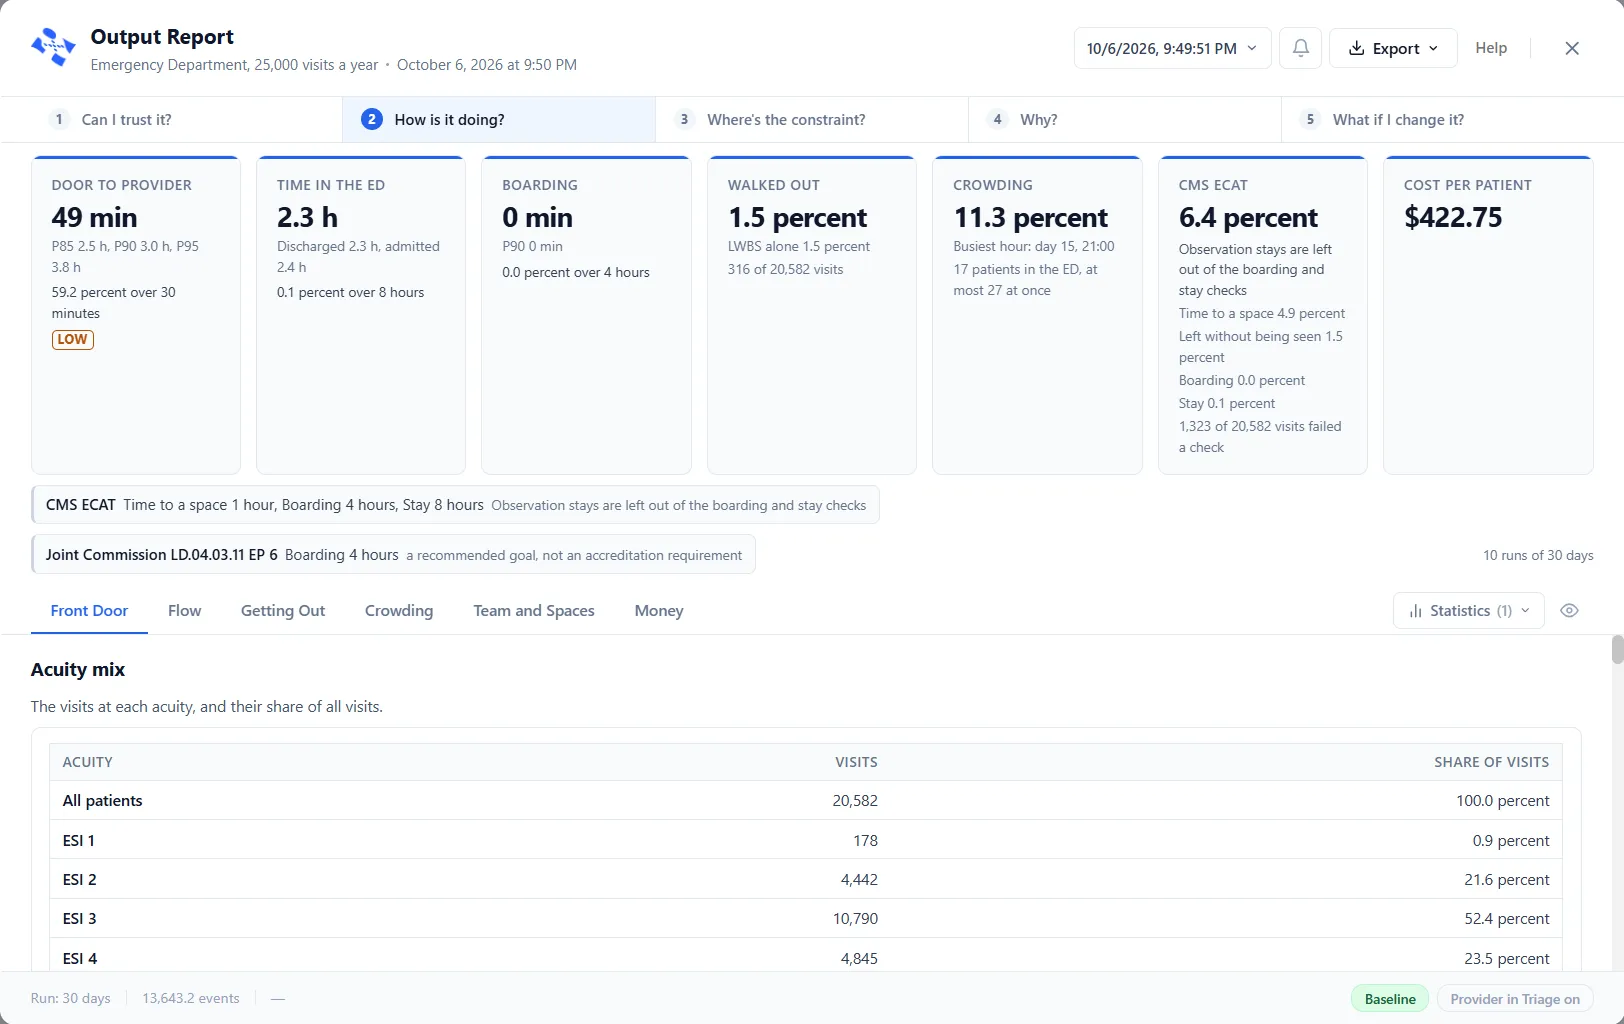
The Money tab gives cost per patient and, with a scenario picked, how that scenario moved it against the Baseline, and the hospital side of the cost stays on its own line so it never hides inside the department’s number. Every screen is covered in emergency department modeling.
A report that names the fix
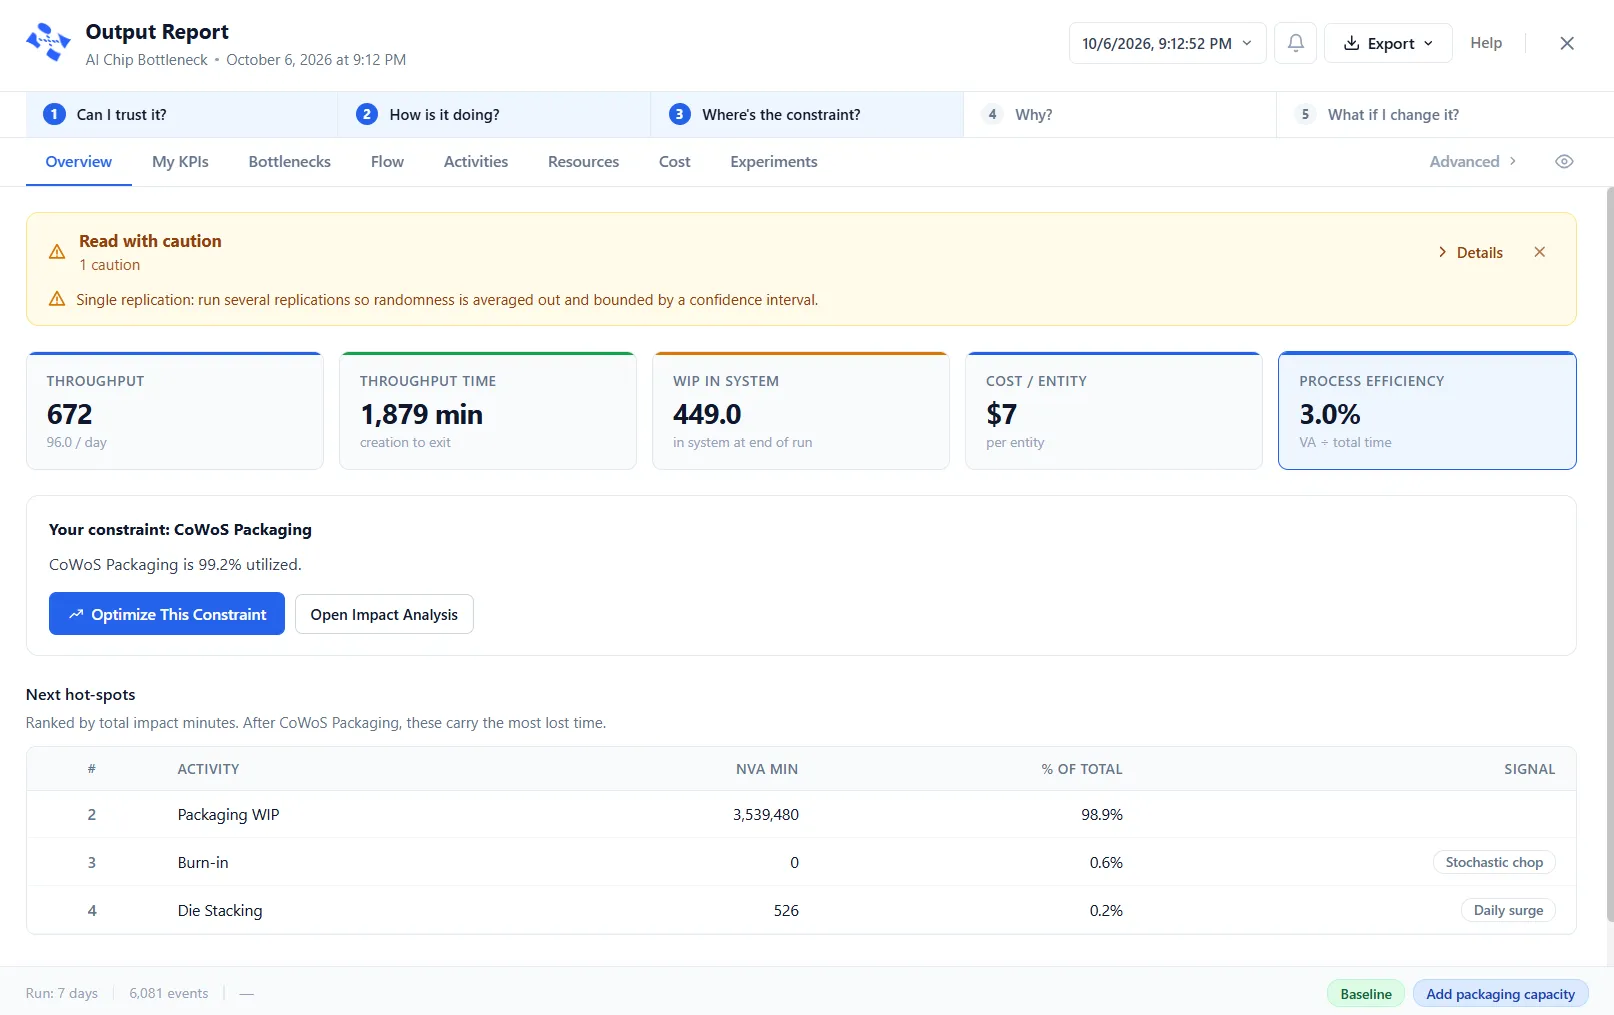
Running a simulation was never the hard part. Reading it was. The ProcessModel 7 Output Report opens with the answer instead of a wall of numbers.
The report opens with the answer
An Overview names your constraint in plain language: which step, how busy it is, how many waited and for how long. Above the tabs, a five-question guide walks you from whether you can trust the run all the way to what happens if you change it, and a trust banner tells you whether to believe the numbers, with the replications and confidence intervals behind them, before you read a single one.
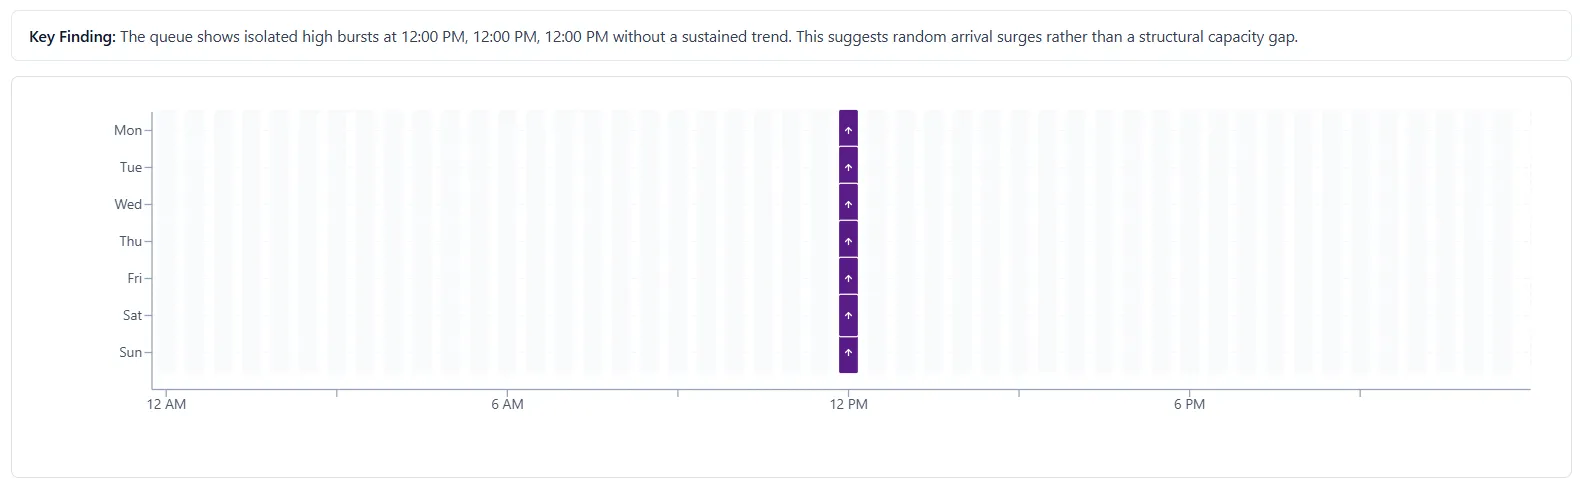
The Bottlenecks tab ranks every wait point by the time it costs and reads each queue’s weekly pattern to name the cause. A daily surge that drains by evening calls for peak-hour staffing, while a queue that never empties means real undercapacity.
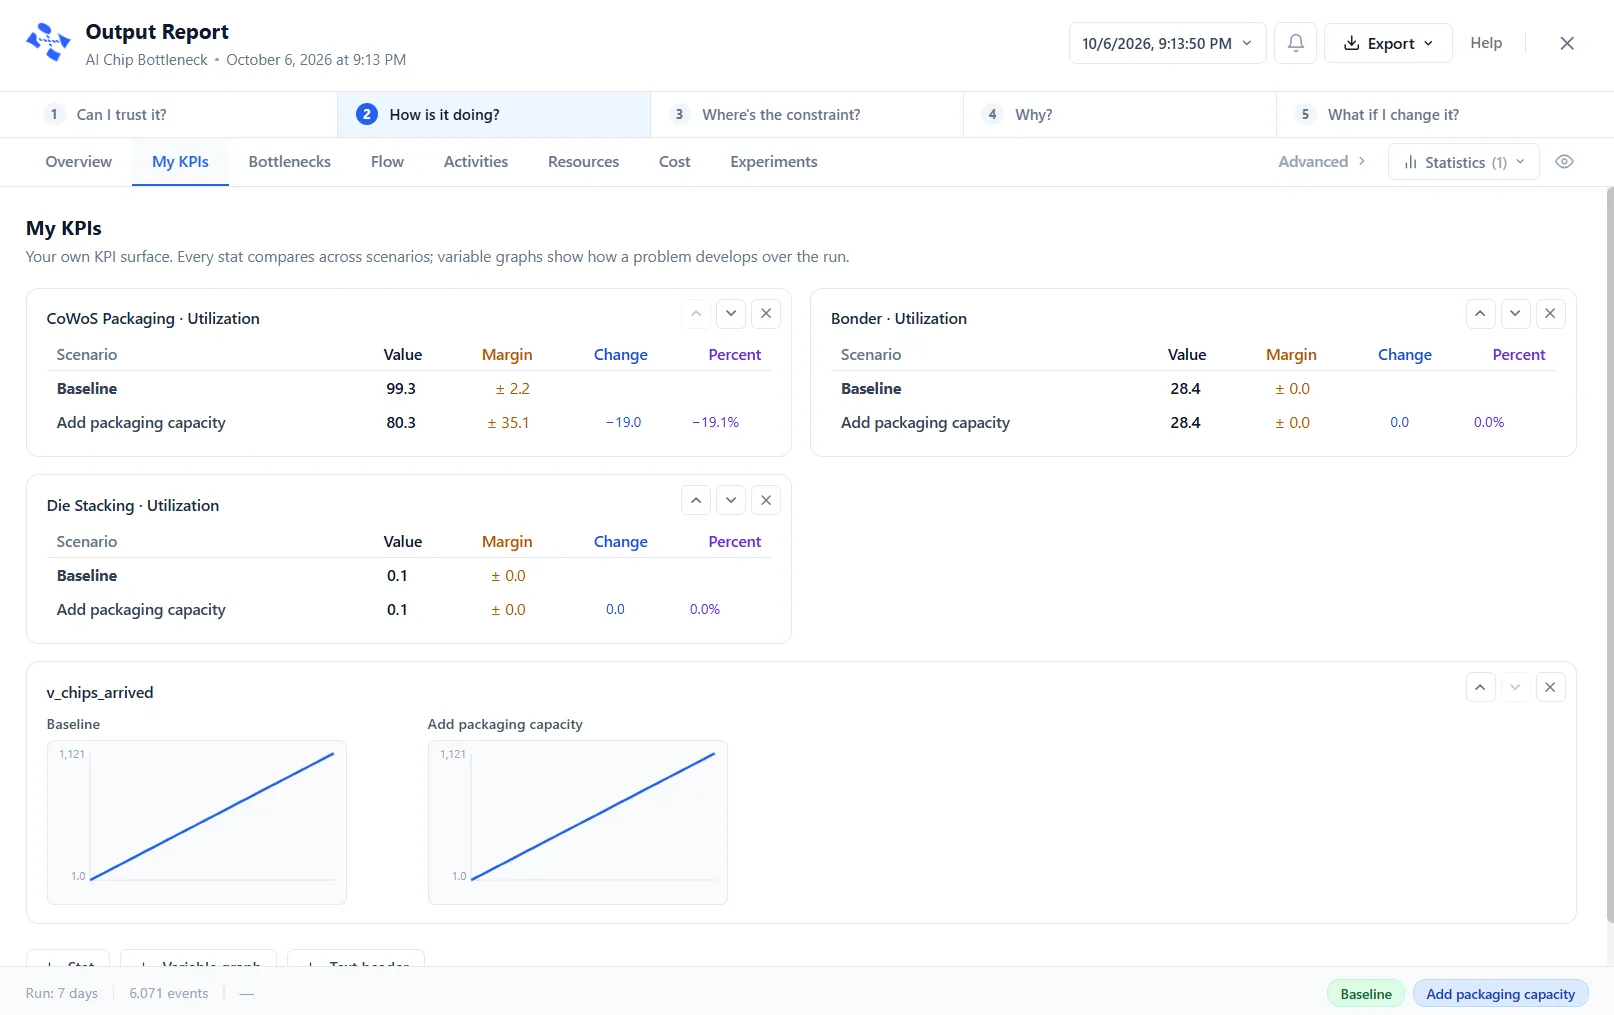
When entity types behave differently, times and costs split by type instead of averaging into a figure that describes no one. A My KPIs tab holds the statistics you care about, each one ready as a scenario comparison, and you can pin a figure to it from the row it sits in. An Experiments tab weighs your scenarios and says in words what improved, what it cost, and where the constraint moves to next.
Rules you can read and change
Under Advanced, Analysis Rules shows the rules that decide what the report calls a constraint, a bottleneck, a surge and a cause. Edit one, apply it, and the report re-reads the run it already has, with nothing to run again. Each model keeps its own rules.
Results the rebuilt engine can stand behind
A report is only as honest as the engine under it, and that engine was reworked. An activity’s Operation, Waiting, Blocked, and Idle percentages add up to 100, and time held behind a closed schedule or a full station reads as its real share of scheduled time. After a warm-up, the report covers only the run that follows it, totals count every dollar once, and cost a carrier picks up reaches the parts inside it. Time units are honored everywhere, a time value the app cannot read stops the run and names the field instead of guessing, and a resource taken in one activity and freed in a later one stays held the whole way between, so utilization reads true. You can read every replication on its own, or average a tracked variable across all of them, with an optional median, a min and max, a standard deviation, or a 90, 95, or 99 percent confidence band.
Find the best setup, not just test one
The report names the one change worth making. PM Optimizer goes further and finds the best change on its own. A scenario tests one what-if at a time, what if I add a second nurse. An experiment answers the bigger question: out of everything you could change, what is the best you can do? It is built into ProcessModel 7, so there is no separate program to buy and wire up to your model.
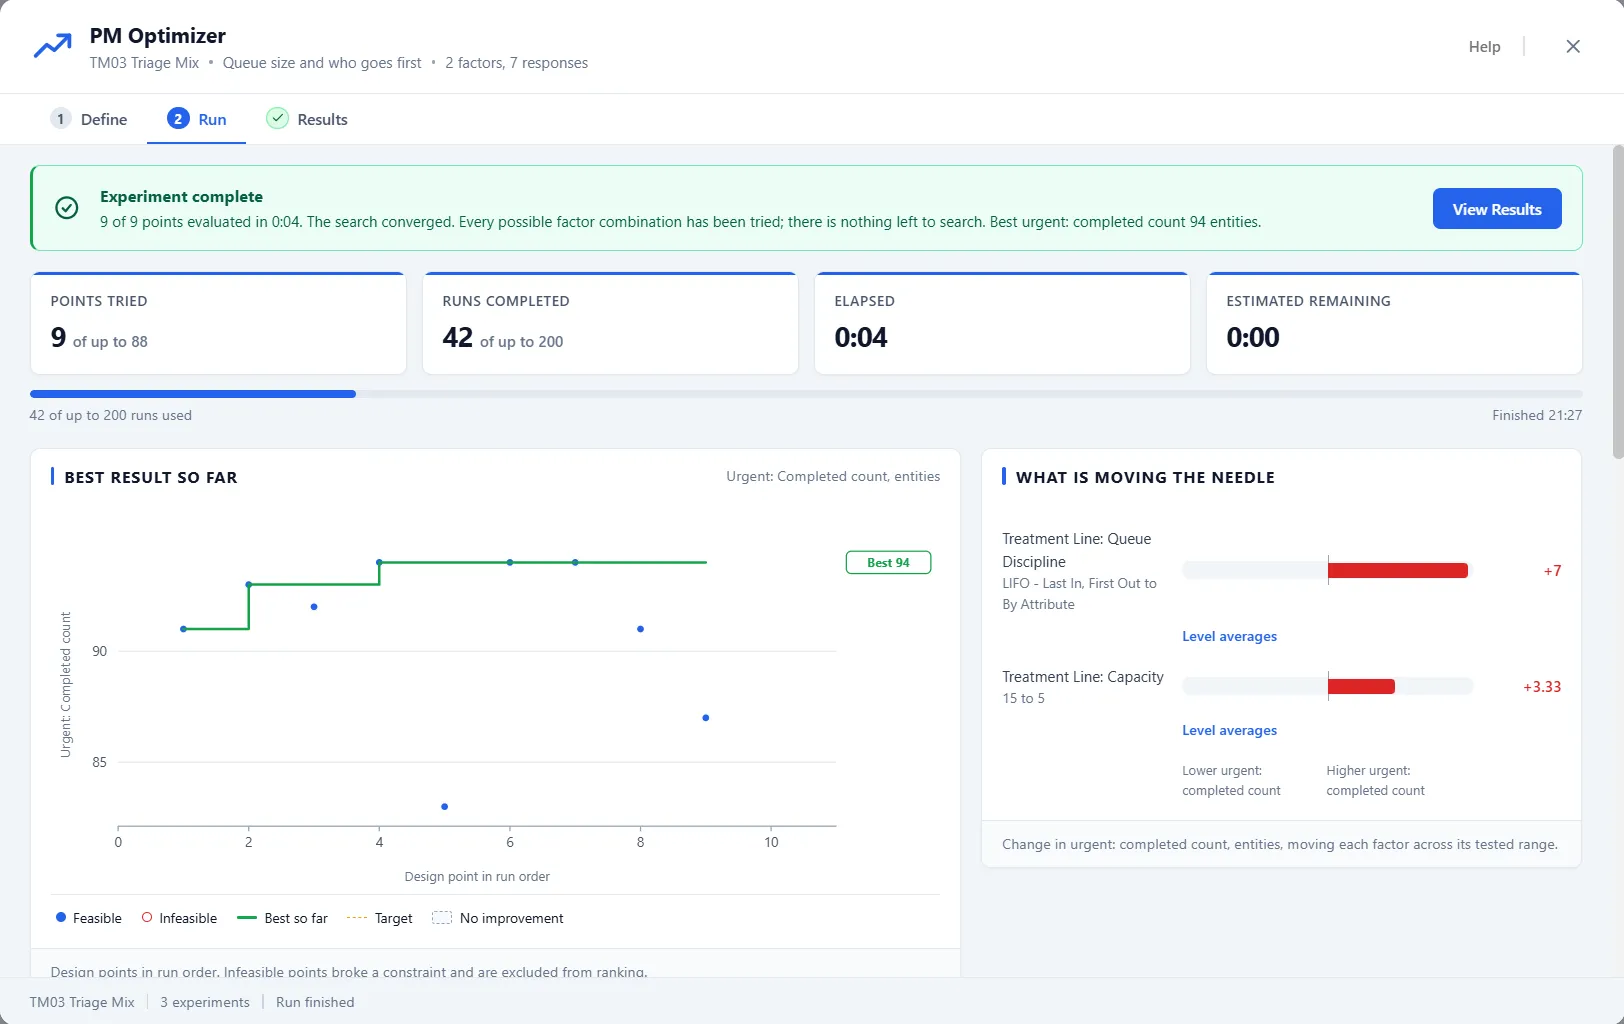
Open it from the Simulate menu and work left to right in three steps. First you define the experiment: pick the settings to vary, the results to measure, and how widely to explore, from every combination to a guided search that learns as it goes. Before the search begins, a short round of probes measures which of your settings actually move the result, and the ones that barely register are unticked for you, nothing deleted. Then you run it and watch a live dashboard with a best-so-far curve, and a stop button if you change your mind.
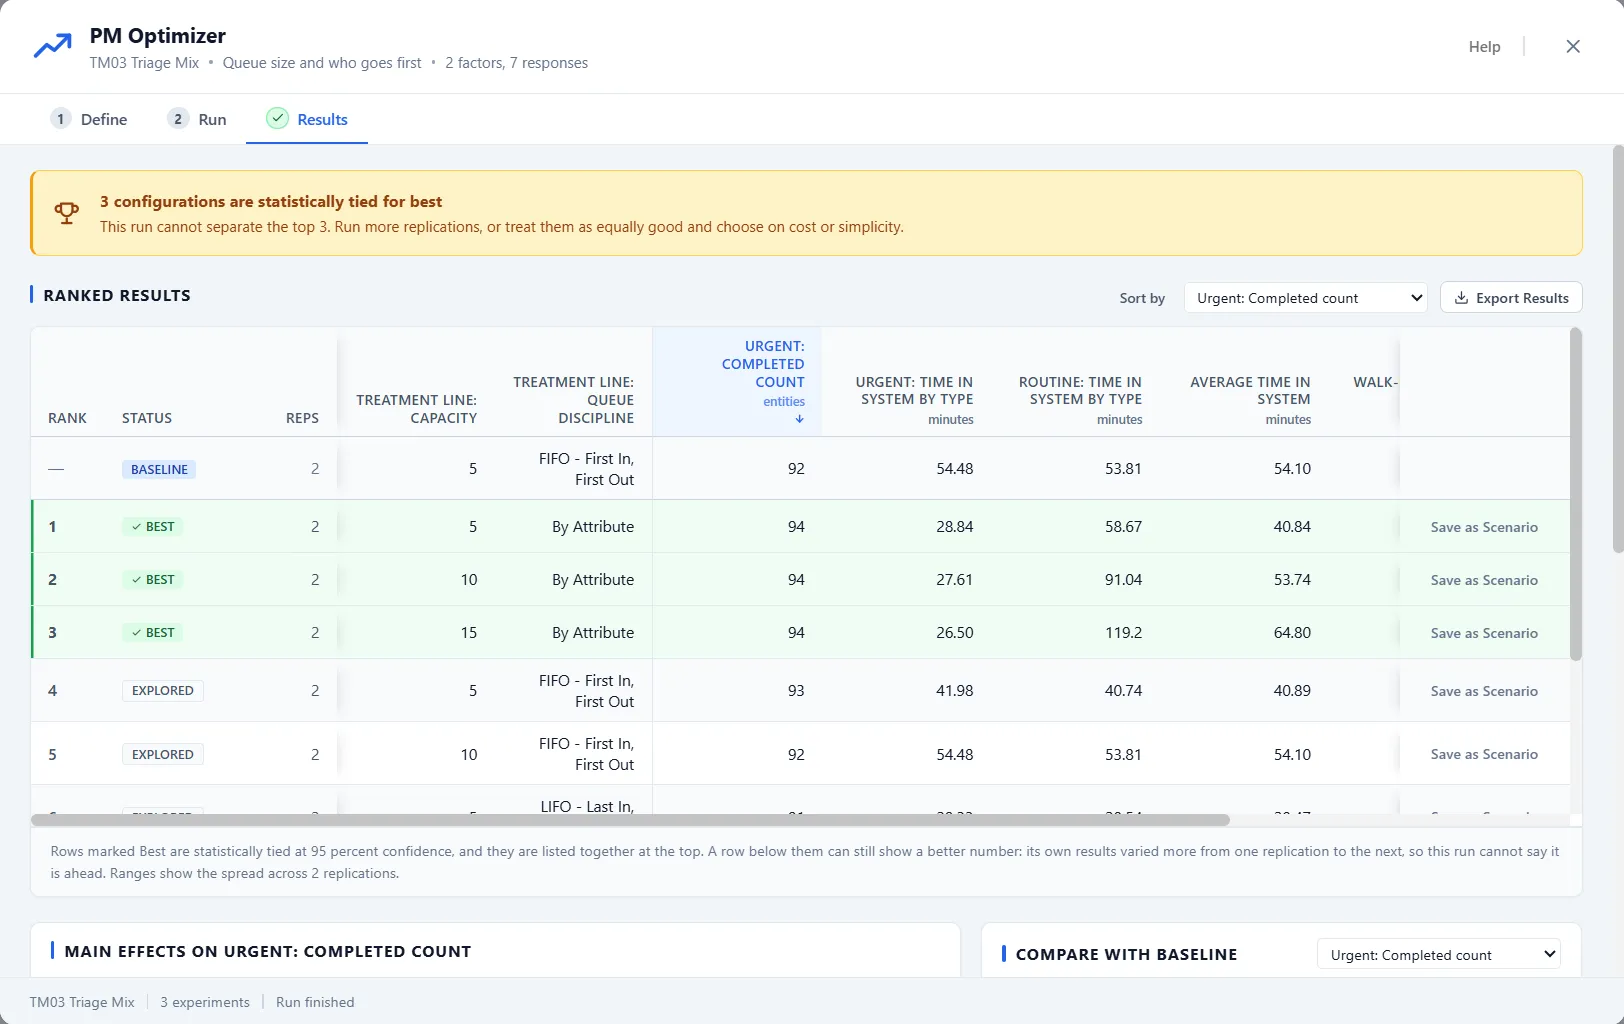
The Results step turns the run into a decision. A band at the top says what the run can honestly claim: when one configuration separated itself it is named, with how much better it is and how sure that is, and when the leaders cannot be told apart it says so plainly. Every configuration is ranked, the leaders are replayed with extra runs so a lucky result never fools you, a chart shows which setting mattered most, and a trade-off view handles more than one goal at once. Save a winner as a scenario in one click, and the experiment leaves your model exactly as it was.
You often do not have to set any of it up. When the report names your constraint, an Optimize This Constraint button hands that finding straight to the optimizer as a ready-made experiment, with the levers chosen from the run’s own evidence and today’s output measured first so it becomes a floor. It never touches your times or your arrivals, because how long the work takes and when demand shows up are facts you declared about your process. The full story is in from guessing to a guided search with PM Optimizer.
One app, fitted to your industry
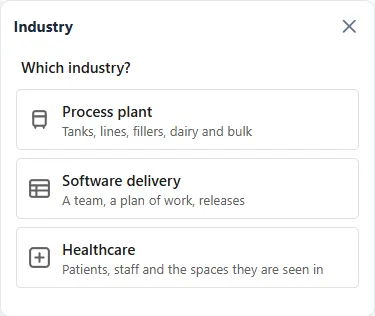
ProcessModel stays one general tool underneath and changes its face on top. Open View ▸ Show Industry Palette and, on a model with no industry, it asks Which industry?, with a card each for Process plant, Software delivery and Healthcare.
Process plant holds three faces, Fluids, Bulk and Dairy, with the parts a plant uses already sized and named for the job: vessels that hold a level, transfer lines that move a set quantity a minute, a manifold, a unit operation, and a filler where liquid becomes countable packages. The results open a Bulk view with a mass balance per material that has to close before anything else can be trusted. There is more in fluid and bulk modeling comes to ProcessModel.
Software delivery is a lens, the way Healthcare is. A Work Table holds the plan of work written down before the run, an entity reads as a work item and a queue as a backlog, and the report shows Forecast, Flow, Team, Quality and Cost in place of the general tabs. The Forecast answers with three finish readings, the day half the runs finished by, the day most runs finished by, and the day nearly every run finished by. Promise the middle one.
Build a daily arrival pattern from your own data
Real demand is not a flat trickle. It has a rhythm, busier on some weekdays than others, with peaks at certain hours. ProcessModel 7 builds that rhythm straight from your own history.
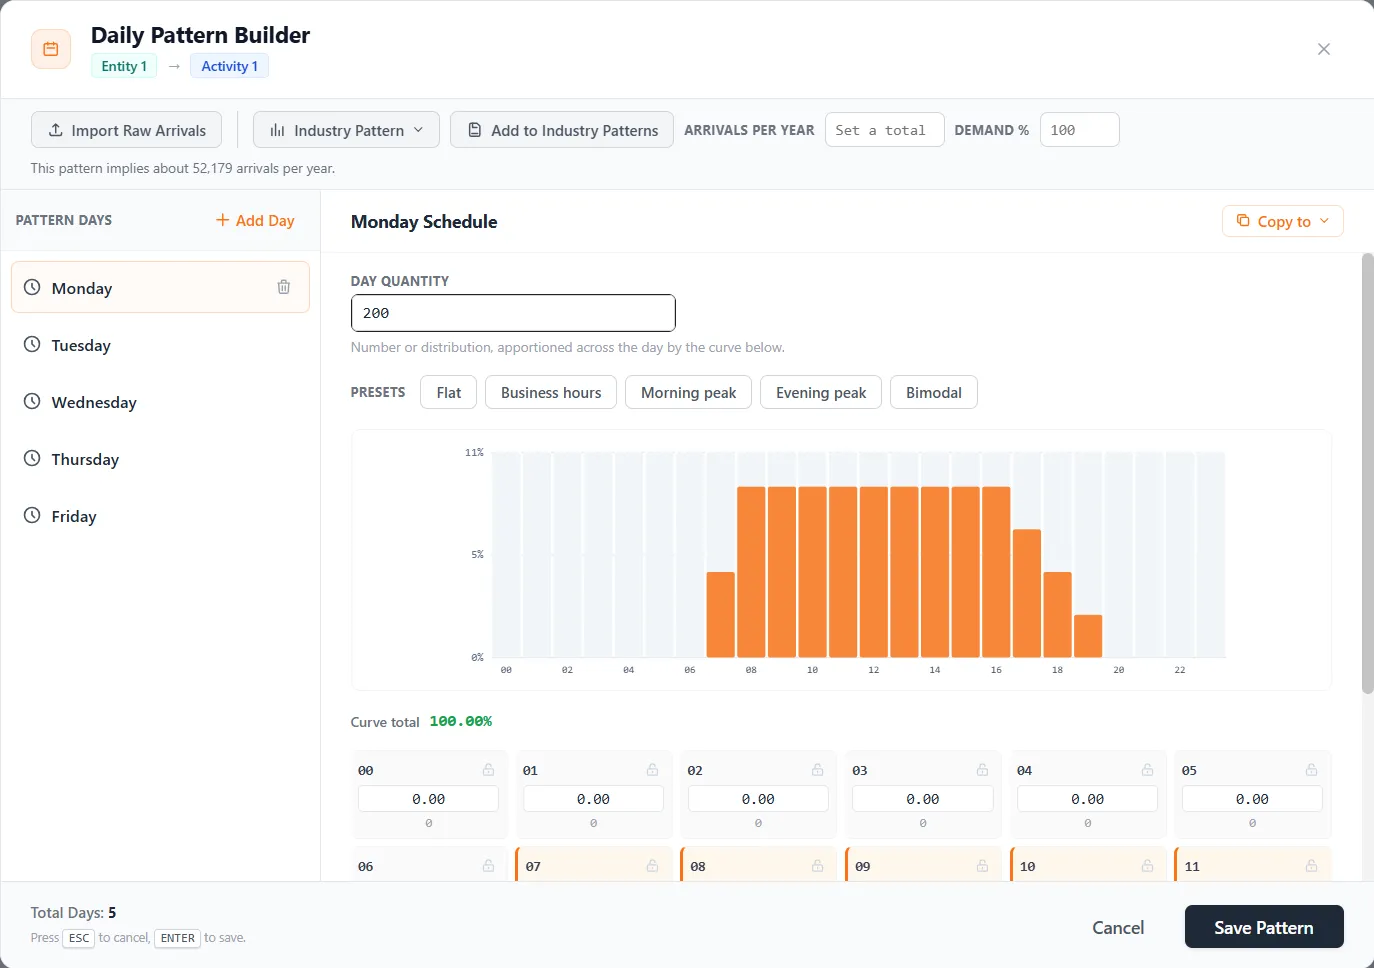
Copy a column of date and time stamps out of a spreadsheet, with an optional priority column beside it, and paste it straight in, or choose an Excel or CSV file. It reads the dates people really have: an afternoon time written as 2:30 PM, year-first dates, and day-first or month-first files, where Auto works out the order from the data itself. The importer reads how many arrivals came in on each weekday, fits a distribution to each one, and builds an hour by hour curve from the actual arrival times, and you can accept its choice or pick a different fit for any day. List the holidays, outages, and one-off events you know were not normal and they come out of the analysis, alongside an Exclude outlier weeks filter that is on by default.
A chart draws every weekday’s weekly totals on one scale, so you can see which days are steady and which swing, opening a single day shows its week to week variation close up, a table lists the weekly numbers by their actual week start dates, and your imported data stays with the model, so reopening the analysis later brings every chart back, still live. Start from a ready-made industry pattern, such as one of the two emergency department profiles that come with ProcessModel, save the patterns you build, and plan for growth by entering the arrivals you expect in a year, or a demand percentage, and watching the whole week rescale while holding its shape. The calendar is honored too: Monday’s arrivals fall on Mondays.
Inventory: take, store, and reorder
ProcessModel 7 models stock as carefully as it models flow.
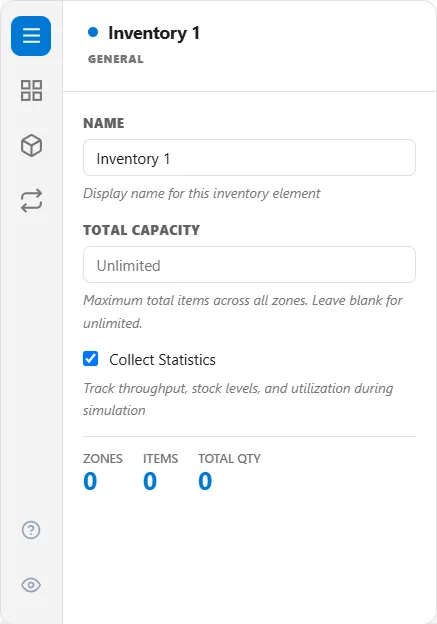
A step can take from or store into an inventory, and the quantity can be a fixed number, a variable, an attribute, or a formula. Give each item a reorder level, a reorder quantity and a lead time, and stock replenishes on its own, with no separate arrival to wire up. Lead time is sampled fresh for every order, so a distribution there puts real supplier variability into your stock levels and stockouts instead of hiding it inside a single tidy average.
Choose a fixed quantity or an order up to a target level, let long-lead items keep several orders in flight at once, and let a take fall back to a substitute when your first choice is out of stock. A store written with WAIT holds a delivery until the whole amount fits, so trucks queue to unload at a full warehouse. Export to Text closes the loop for every item: fill rate, backorders, time out of stock, reorders, units lost to capacity, the value of the stock on hand, and the holding and ordering cost it ran up, all of it carried into scenario comparisons so you can weigh stocking policies the way you weigh everything else.
Caseload, shifts, and calendar-accurate schedules
Work happens on a calendar and a clock, and ProcessModel 7 respects both.
Put an activity on a shift
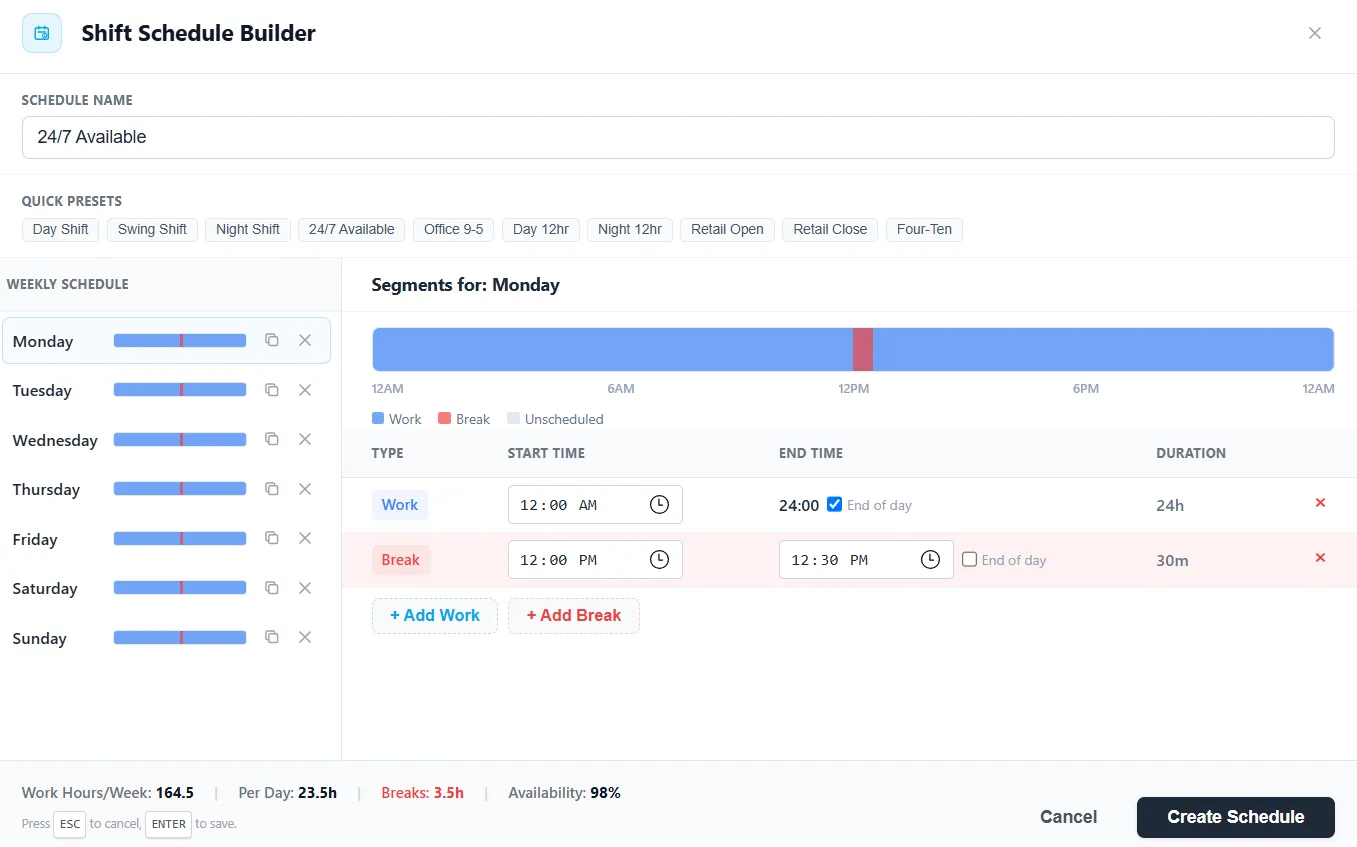
Assign a schedule on an activity’s Shift tab and the activity starts no new work outside its scheduled hours. Choose what happens when the shift ends: finish what is already started, pause a task partway and resume it next shift, or work past the end to clear the queue. Decide what happens to waiting work, and set a short start-up delay at the beginning of each shift. On the canvas the activity grays out while it is off shift, and the report bases utilization on scheduled time, so the number reads true.
Schedule routes that follow the calendar
A schedule route opens by time of day, by weekday, by a shift calendar or at a cutoff time, and several can leave one activity. While a window is closed an Alternate route is tried first, and with none, work waits at its source until the window opens, so nothing is lost. The week starts on your Start day, and that holds for schedule routes, resource shifts, and activity shifts alike. A schedule that can never open, no days chosen or a calendar that does not exist, stops the run and names the route instead of quietly staying open around the clock.
Caseload, assigned and visible
Give a case its own worker who handles it on every visit, and set two limits per worker: how many active cases they can hold, and how much total workload, where each case can carry its own weight by something like patient acuity. An Assign only connection claims a worker’s free capacity for a case without pulling that worker off what they are already doing, and a case pointed at a whole group goes to the on-shift worker who is least full against their own limits, so small peak-time teams are protected on their own. When a worker goes off shift, their open cases go to the partners you name, and during an animated run the Track board shows every worker’s load against both limits, who is next in line, and what is holding them up.
Scenarios, without touching the model
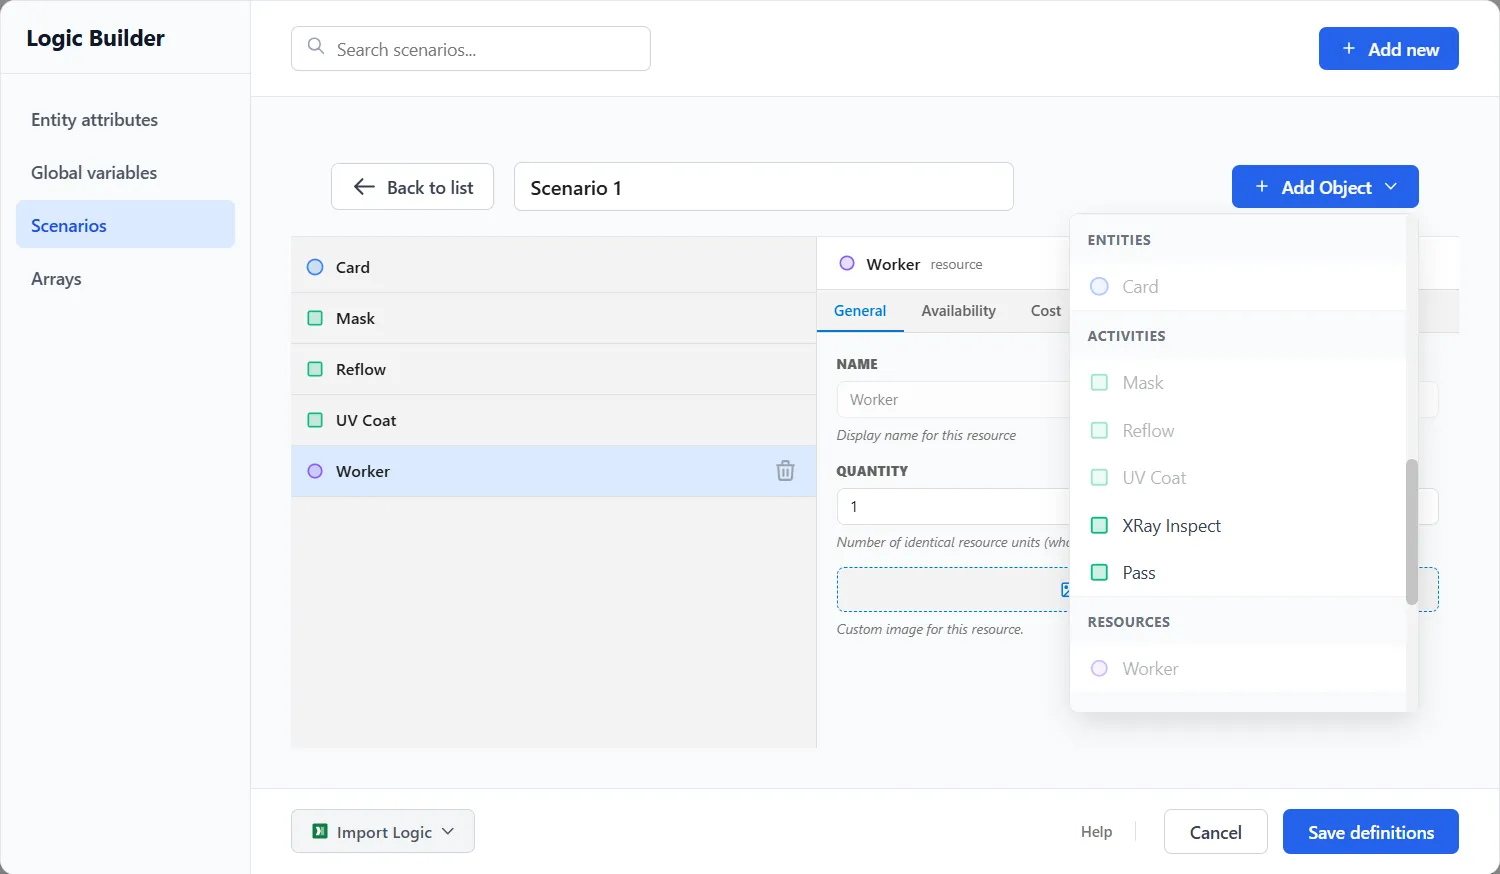
Scenarios let you ask a question without changing your model. A scenario is a set of changes on top of the base model, made on the real field of the real object inside it. Adjust an arrival as a new quantity or spacing, the volume you expect across a year, or a percentage more demand, or turn an arrival off entirely to see the operation without it, and change gates and inventory items the same way. The base model stays exactly as it was, every enabled scenario runs beside the Baseline, and the report shows each one as its own column.
Smarter routing on a cleaner canvas
Routing in ProcessModel 7 keeps a busy diagram readable and moves work exactly where you mean it to go.
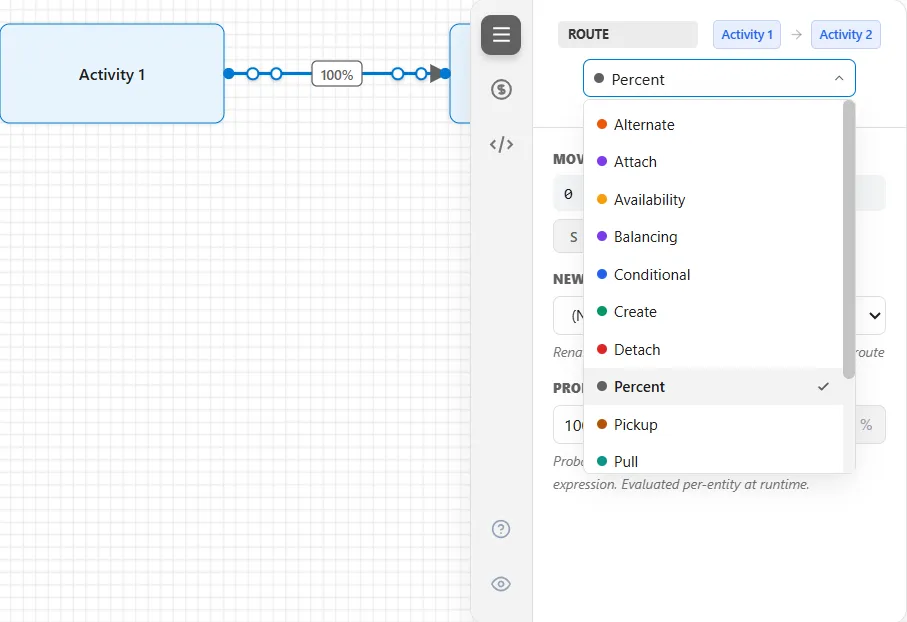
Routes steer around the elements in their way instead of crossing through them, and they re-route the moment you move a shape. Two routes meeting at one element fan apart, corners are gently rounded, and hovering a route highlights it by dimming the rest, so you can grab the one you mean even where lines overlap. Arrange ▸ Routing settings sets the rounding, the spacing and whether routing steers automatically or draws plain lines you shape by hand, and a route that would stretch clear across the diagram can go off-page and collapse to a matching labeled marker at each end.
Routes carry more than direction now. Assign a resource to a move the way you assign one to an activity, a forklift to carry a load, or a driver and a truck seized together, and the item waits for the resource before it travels. A Decision element gives a branch point the classic diamond shape, with no delay by default, and a Transition point joins two different kinds of route directly, such as conditional routes coming in and an attach route leaving. The logic you write on a route does what you would expect: Wait Until, Get, Use For, and Route To hold or move the item on a route, in queue logic, and in a Process Table row.
Gates that genuinely control the flow
A gate is a barrier that decides when work is allowed to move on. It does no work of its own and holds nothing; it simply opens and closes, releasing entities while open and making them wait while closed. In ProcessModel 7 it is a full subsystem rather than a checkbox.
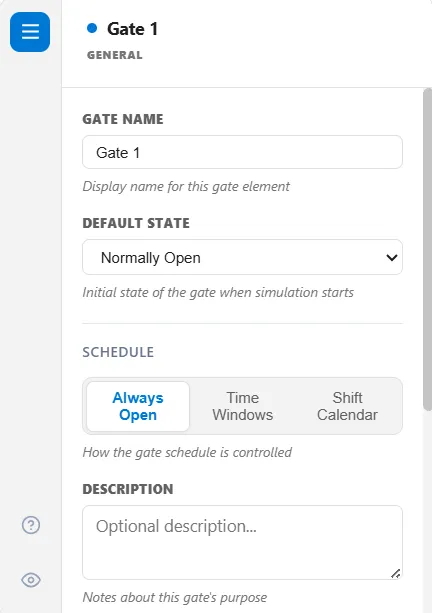
Set whether a gate starts open or closed, then put it on a clock with time windows you write or a shift calendar you already built. Open or close it instead from a live condition, which is how it reacts to a signal, or from your logic, and once your logic takes control of a gate it keeps control for the rest of the run. Or hand the gate to downstream demand and run it as a pull or kanban control that releases only when the next step has room. While it is open you decide how many go through, one at a time, a set number, everything at once, or at a limited rate, and entities that arrive while it is closed wait in the gate’s own queue in the order you choose, with a queue capacity that backs them up upstream when the gate is full.
40 ready-to-run demo models
The fastest way to learn what ProcessModel can do is to open a model that already works.
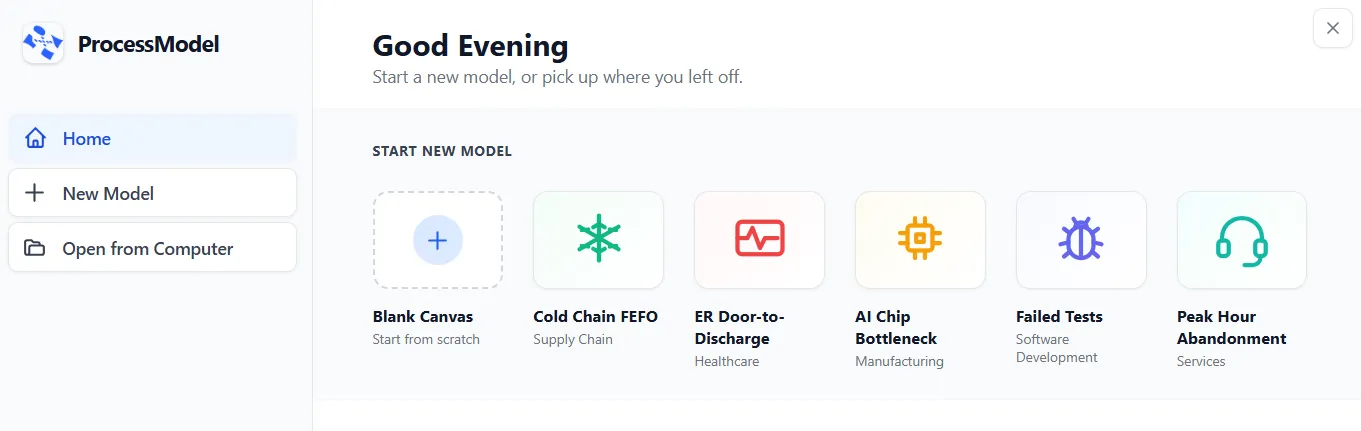
ProcessModel 7 comes with 40 ready-to-run models: 38 worked examples grouped under eight industries, healthcare, manufacturing, dairy, supply chain, services, software development, defense and government, and the two models the self-teaching guides build. Each example is built around a single clear problem and the one change that fixes it: an ENT clinic whose hour-long waits turn out to be about exam rooms rather than doctors, a distribution center where whole orders wait on one slow pick zone, a drive-thru where a single large order jams the lane.
Open File ▸ Demo Models, pick an industry down the left side or search by any word in a title or description, and read the Brief on a card first: the situation, what was tried, what the simulation showed and the takeaway. Every demo opens as a new, unsaved model, so you can run it, change it, and save your own copy while the original stays pristine, and five of them wait on the Welcome screen as tiles, one click from running.
Action Logic and Process Tables
The tools for writing model logic grew up in ProcessModel 7. Write logic as cards in the Action Logic Builder or as text in the Action Logic editor and move between the two: what you build as cards reads back as code, and the other way round.
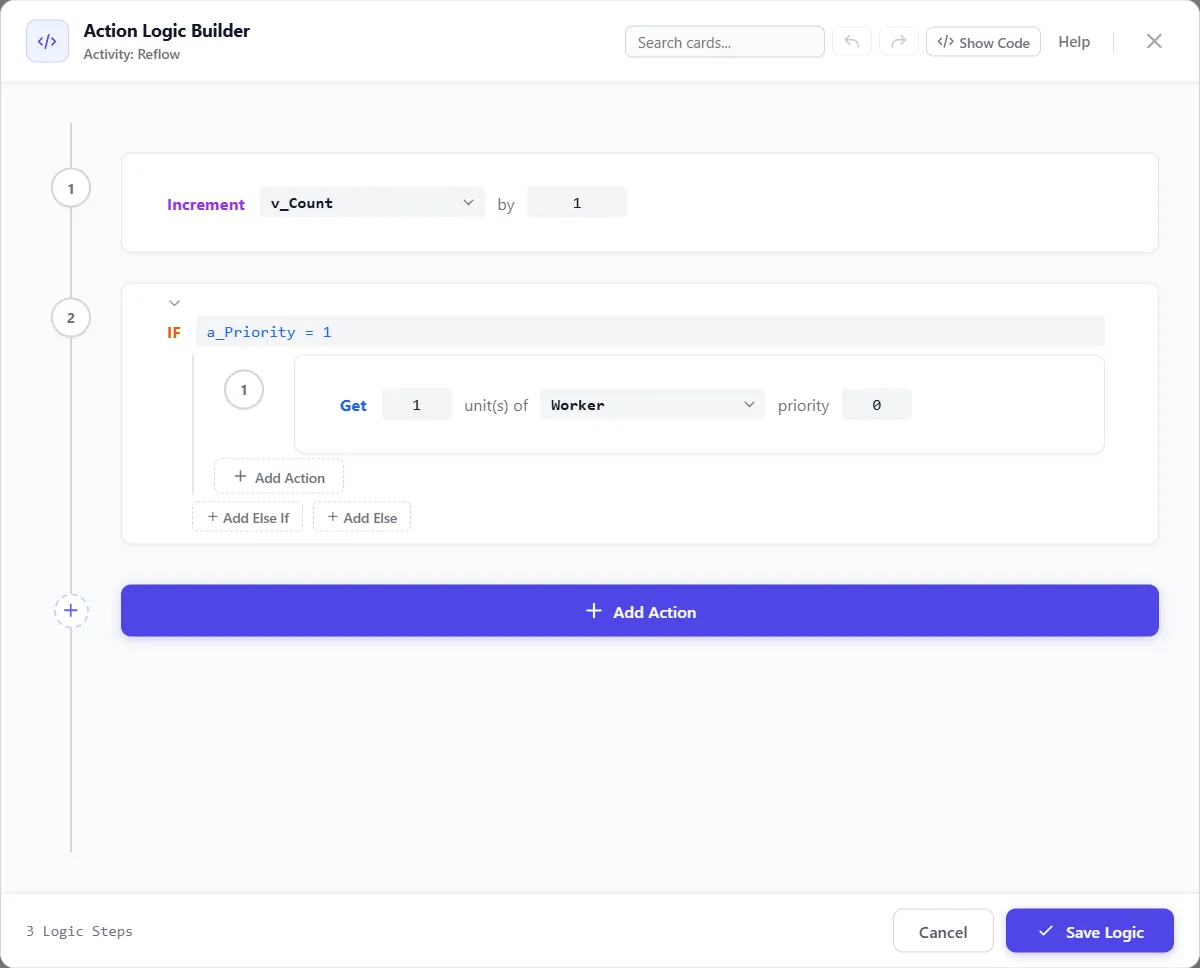
Create attributes and variables without leaving your logic
Type a name the model does not have yet and the editor offers to add it in one click. A small button reads 1 new, and hovering it names exactly what will be created, with the type and starting value it worked out from how you used the name. Nothing is created without your click, a name within one character of an existing one is flagged as a probable typo rather than added, and a message after the click offers to undo it. When the only thing stopping a run is names the model does not have yet, Simulate offers to add them and run instead of handing you a list of errors.
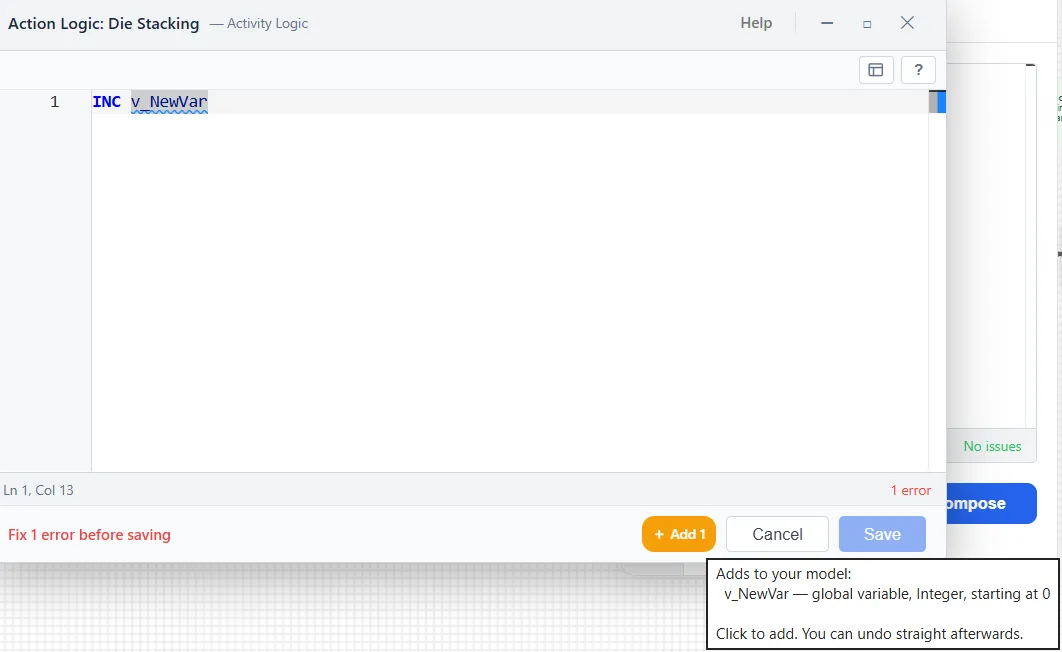
ProcessModel checks your logic as you write it and before a run: an IF with the wrong number of parts is named, an IF on a line by itself is caught, a misspelled entity property is caught when you write it, and every error in a field is listed, not just the first.
Process Tables that capture a real decision
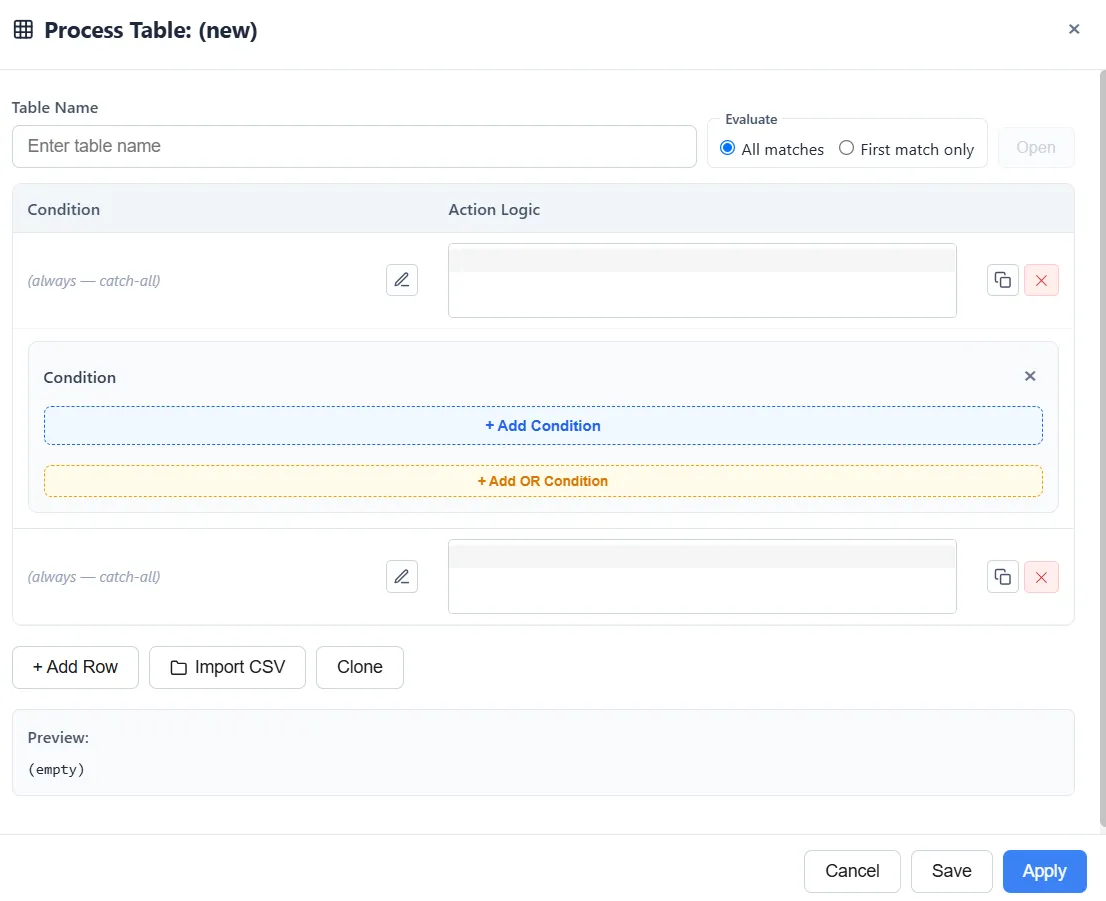
A Process Table row takes a full condition instead of a single test, combining attributes and variables with AND and OR, high-acuity patients and a waiting room holding more than fifteen, built with the same visual editor you use on routes. Tables match on an entity’s own properties, its type, id, group quantity, age, and time in system, and matching ignores capitalization so a small difference in spelling still connects. Duplicate a row to spin off a variant in one click. As you write ProcessTable in the Action Logic editor your defined tables are offered, with a Define Process Table action beside them, hovering a table’s name previews how it decides which row applies, and a table named in your logic becomes a link that opens it.
More tools in the box
Additions that are small to describe and save an afternoon each.
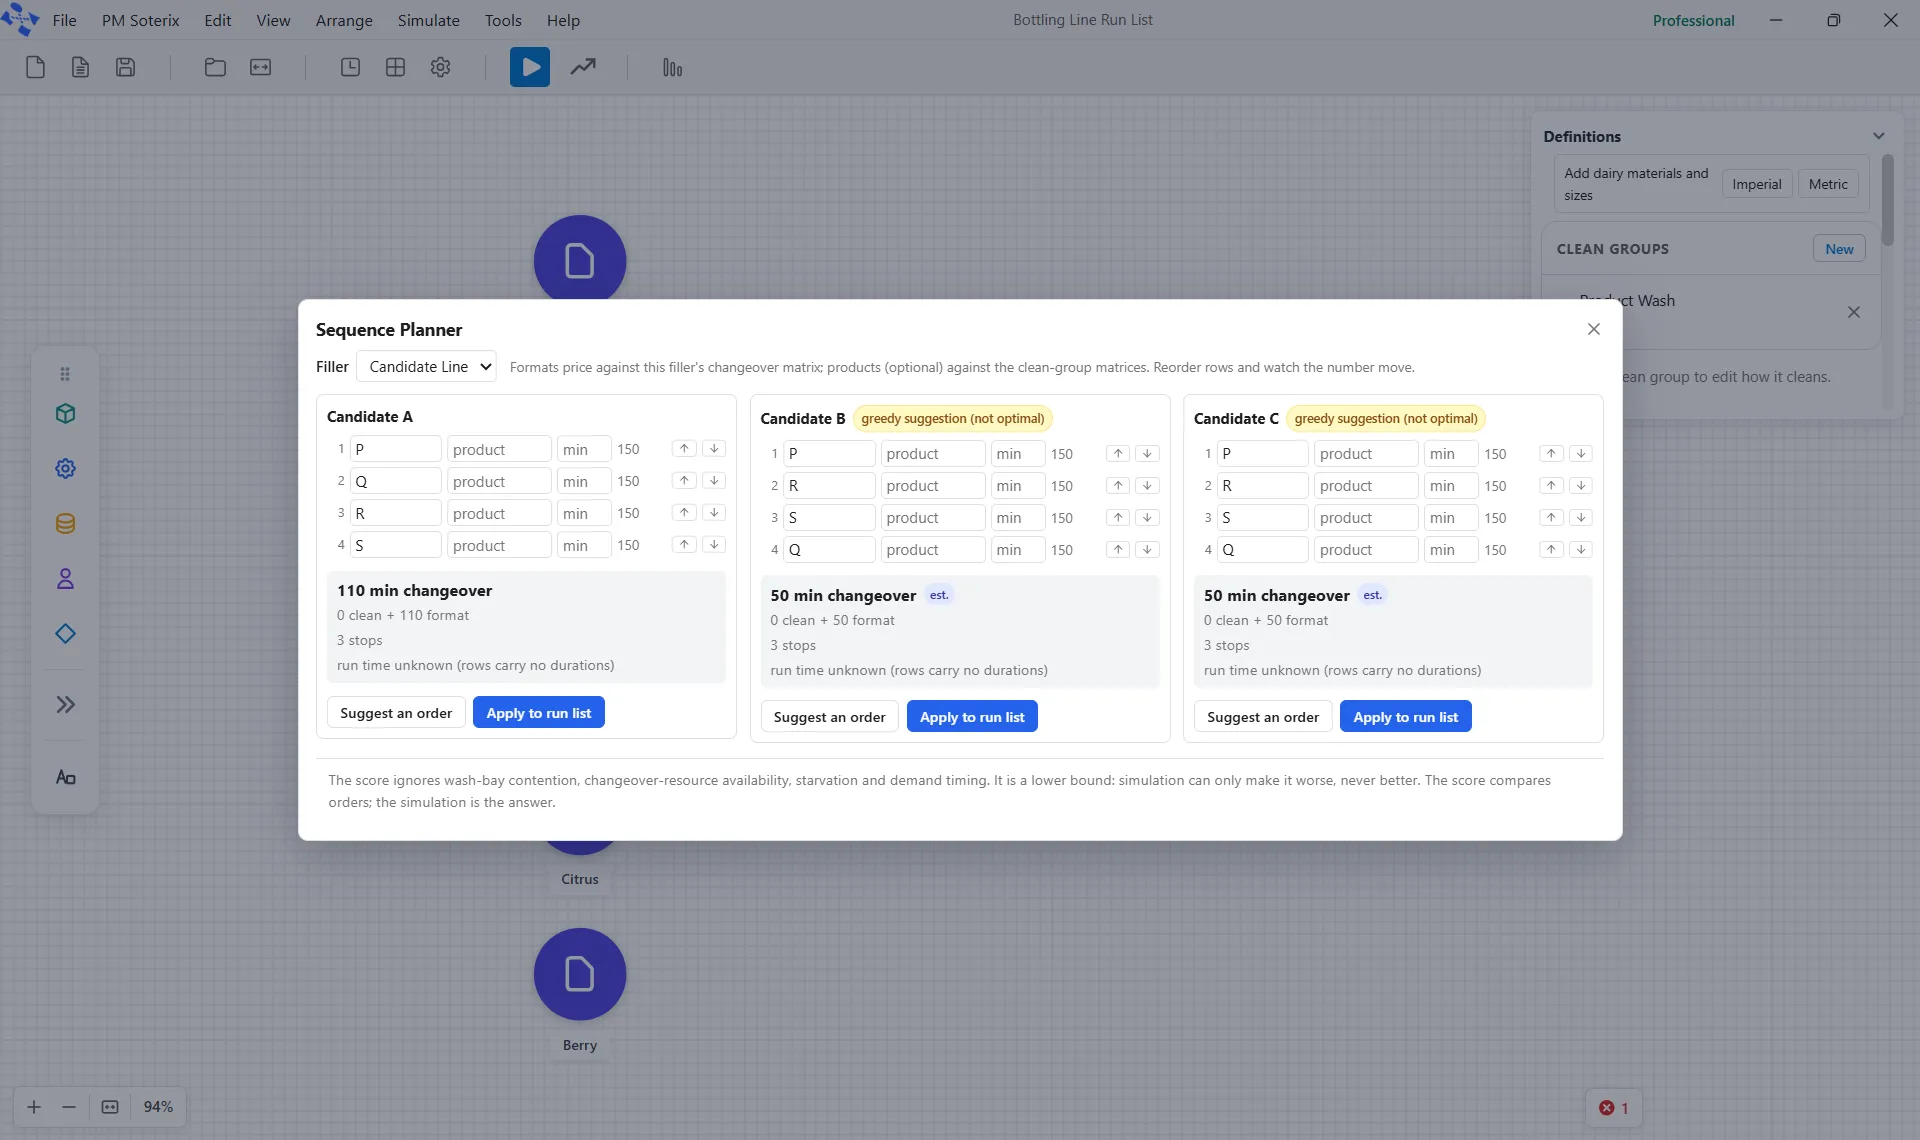
The Sequence Planner, on the Simulate menu, compares candidate run orders for a filler and prices each one against that filler’s own changeover matrices: total changeover minutes, the split between cleaning and format changes, and the number of stops. Three candidates sit side by side, the first seeded from the order you run today, and when you reorder a row the score moves with it. It is straight about its limits: a suggested order is badged as not optimal, and a note says the score compares orders while the simulation is the answer.
Import Recipe turns a recipe you can paste, a formula and a list of operations in order, into a working model, with the columns mapped by you rather than guessed from the headings. It asks what the recipe cannot state, such as how the document reports its yields, and tags everything it assumed in a preview before a shape is drawn.
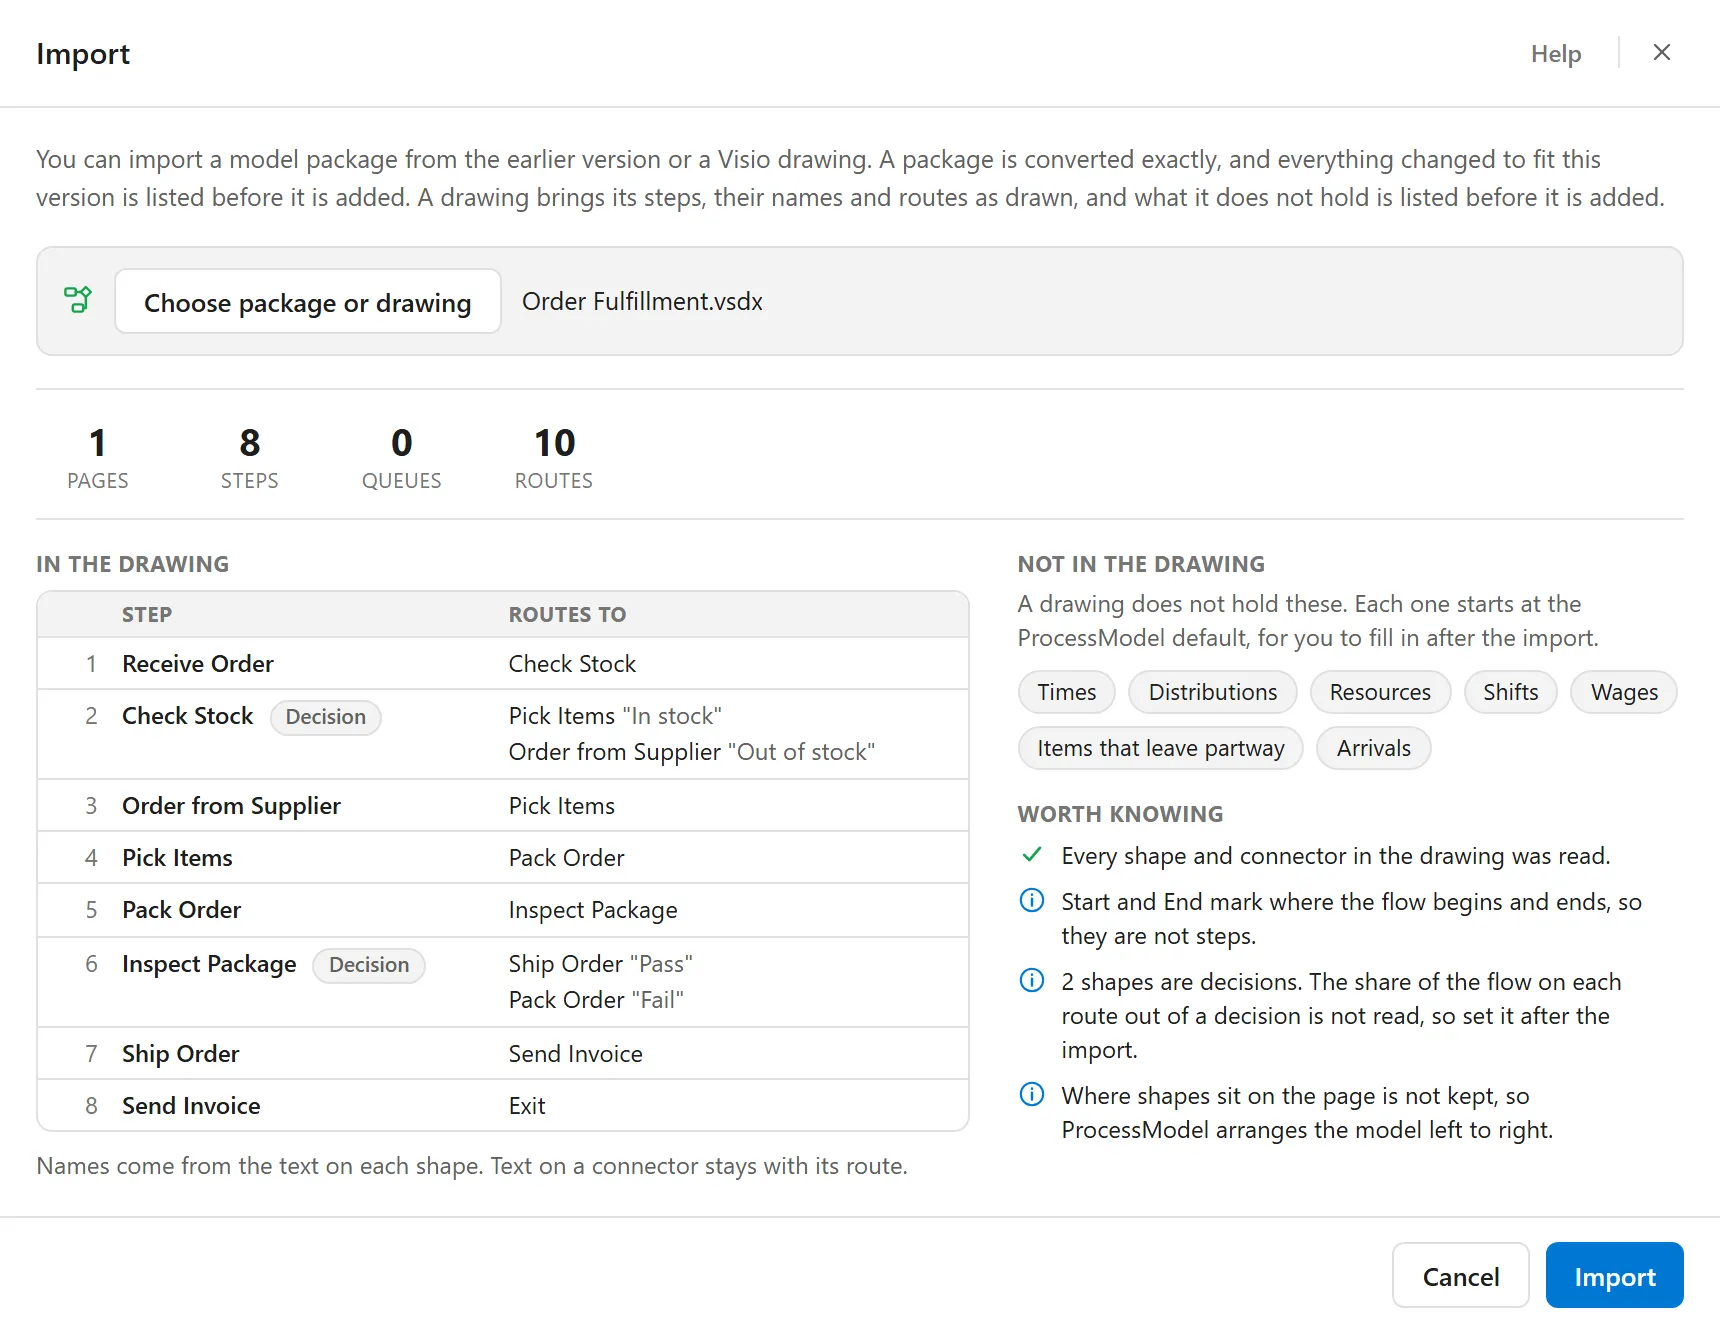
File ▸ Import brings a model made somewhere else into ProcessModel: a model package from the earlier version, or a Visio drawing. The window reads the file at once and lists what it recovered, what was changed to fit this version and what the file does not hold, before anything is added to the canvas. A drawing brings its steps, their names and its routes as drawn, and times, resources and shifts start at the defaults, listed for you to fill in.
Decision Trace answers the oldest question in modeling: why did that go there? While a run animates, a small chip appears each time a routing decision fires, naming the reason and the route taken. A plain single route produces nothing, so everything you see is a fork the model genuinely chose between. The chips show at an animation speed of 20x or slower, and a trace worth keeping can be saved and replayed without running the model again.
Time Tables give a step or a move a different time for each kind of entity: priority 1 takes 3 to 8 minutes, priority 2 takes 6 to 14, and a time for everything else. Write the table’s name into a time field, even inside a longer expression, and a name the model does not have stops the run with a message that names the field and the table.
Cost fields take an expression. Per-Entity Cost and Processing Cost can be worked out for each entity, so a charge follows the batch size or any attribute or variable.
Simulation options you can search
Simulation options is arranged in six groups down the left, each with a sentence on what it is for. Type a word in the search box and every group is searched at once, and you can change a setting right where you find it. A blue dot marks a setting you have moved off its default, with a link to put it back, and the footer names what Apply will change.
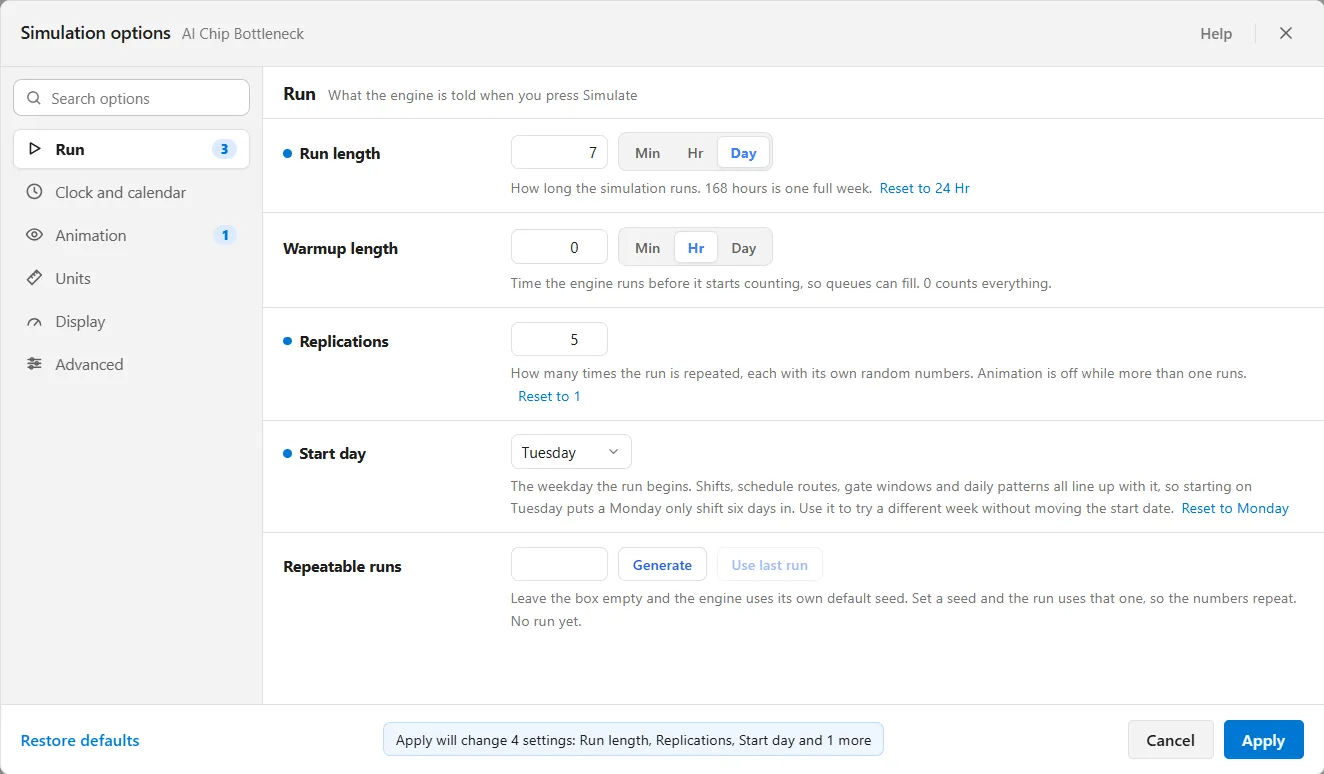
Runs end the way you expect, too. A run with a warm-up plays all the way to the end, and the clock counts the warm-up down before it counts the run. The question Would you like to view the results? appears whenever a run finishes, and stopping a single run early asks it too and marks the results as partial. A seed you type under Repeatable runs repeats the run.
Signing in, and staying up to date
The pieces around the modeling got easier too. Sign-in opens in your web browser, and ProcessModel comes to the front on its own as soon as the browser confirms you are signed in. ProcessModel checks for a newer version on its own, and Help ▸ Check for Updates checks whenever you like, with Install now, Install on exit or Remind me later when one is waiting. Large models deliver their results, too: a year-long run opens its report the moment the run completes, and with animation off a big run finishes faster while still delivering every number the report reads.
See it for yourself
That is the shape of ProcessModel 7, and it is still only the highlights. For the full version-by-version history, every feature and fix in order, read the complete changelog. When you are ready to build your own model, start a free trial, or get in touch if you would like a walkthrough first.